S&P500 Daily Action Areas & Price Targets 6/11/26
S&P500 Daily Action Areas & Price Targets 6/11/26
***QUOTING ES1!(Z CONTRACT LEVLES) FOR CASH US500 EQUIVALENT LEVELS, SUBTRACT POINT DIFFERENCE***
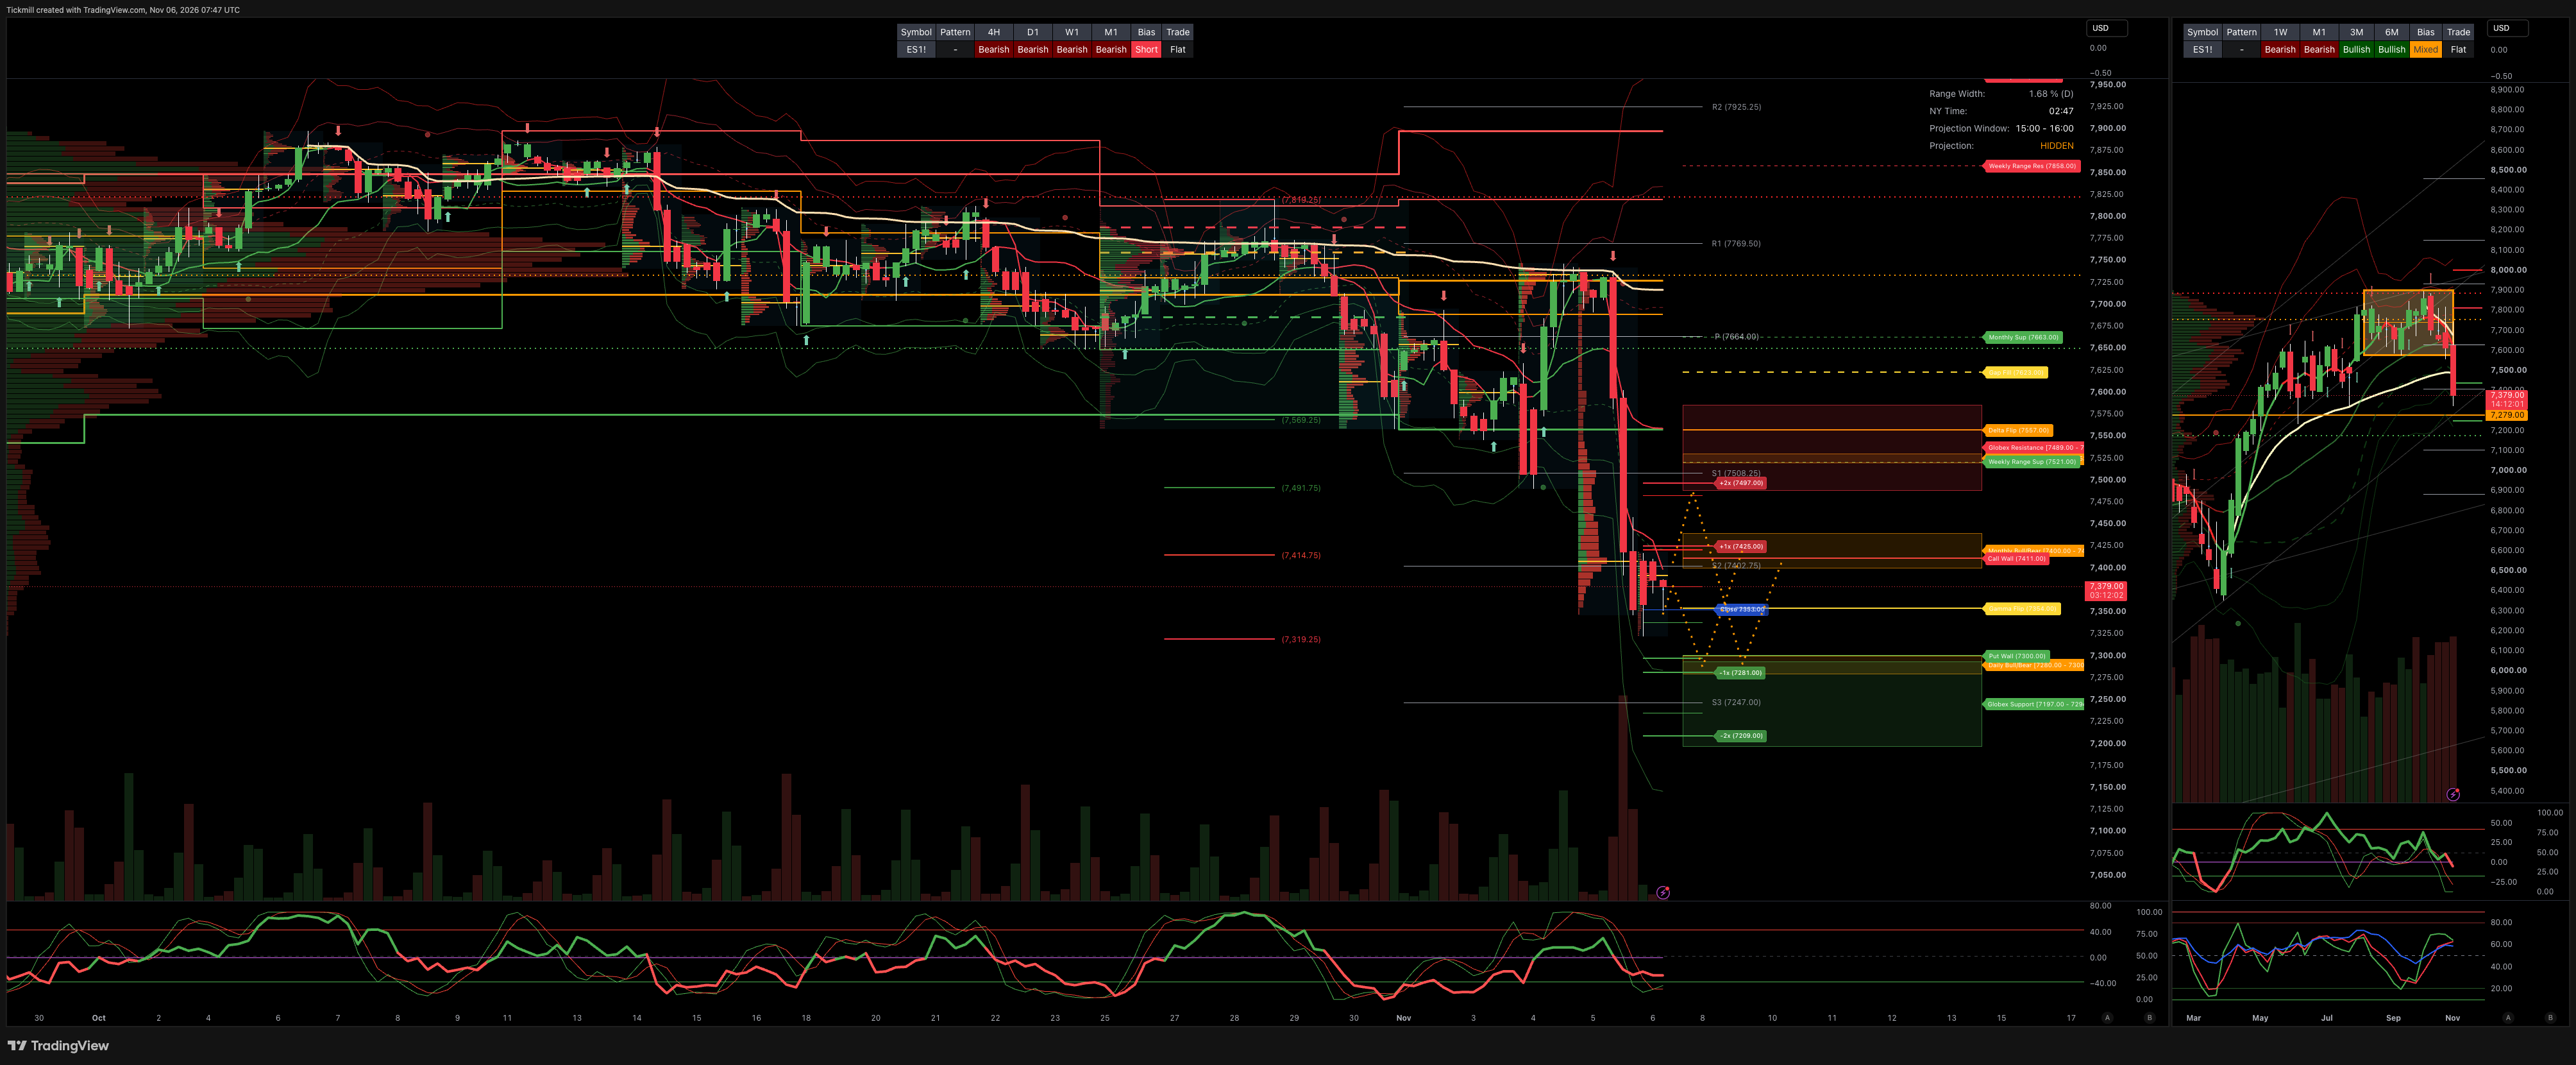
MONTHLY-WEEKLY& DAILY LEVELS
MONTHLY BULL BEAR ZONE 7440/7400
MONTHLY RANGE RES 7960 SUP 7663
WEEKLY BULL BEAR ZONE 7530/20
WEEKLY RANGE RES 7858 SUP 7521
DAILY BULL BEAR ZONE 7300/7280
GLOBEX RANGE SUP 7294/7197 RES 7489/7586
GAMMA FLIP 7354
DELTA FLIP 7557
CALL WALLS 7411
PUT WALLS 7300
DAILY STRUCTURE - OTFL - 7712
WEEKLY STRUCTURE - OTFL - 7794
MONTHLY STRUCTURE - OTFL - TBC
VIX BULL BEAR ZONE 18.72
VVIX-to-VIX < 5 (Current ~4.79). A ratio below 3.5 can sometimes act as a contrarian bullish signal after a washout, while values near 4.8 indicate balanced pricing relative to the current VIX level
PRIMARY TRADES & TARGETS
LONG ON REJECT/RECLAIM DBBZ TARGET RTH CLOSE
***ADDITIONAL SETUPS & TARGETS HIGHLIGHTED ON THE CHARTS***
(I FADE TESTS OF 2 SIGMA LEVELS ESPECIALLY INTO THE FINAL HOUR OF THE NY CASH SESSION AS 90% OF THE TIME WHEN TESTED THE MARKET WILL CLOSE ABOVE OR BELOW THESE LEVELS)
SPX PUT/CALL RATIO 1.26 (The numbers reflect options traded during the current session.) A put-call ratio below 0.7 is generally considered bullish, and a put-call ratio above 1.0 is generally considered bearish.
JHEQX Upside cap (~7,920–7,950): Dealer gamma hedging at this call strike creates resistance, with market makers likely selling futures into strength and limiting volatility. Downside cushion (~7,270): If SPX drops 5% into Q4, long put gamma may force dealers to buy futures as the index falls, helping stabilize prices. Expiration: December 31, 2026. Strong pinning effects are likely near key strikes into year-end expiration.
DEC2025 OPEX to DEC2026 OPEX is 945 points giving us a range of [5889,7779]
Notes On Structure Implications
Balance: This refers to a market condition where prices move within a defined range, reflecting uncertainty as participants await further market-generated information. Our approach to balance includes favouring fade trades at the range extremes (highs/lows) while preparing for potential breakout scenarios if the balance shifts.
One-Time Framing Higher (OTFH): This represents a market trend where each successive bar forms a higher low, signalling a strong and consistent upward movement.
One-Time Framing Lower (OTFL): This describes a market trend where each successive bar forms a lower high, indicating a pronounced and steady downward movement.
GOLDMAN SACHS FICC & EQUITY TRADING DESK VIEWS
EQUITY & VOLATILITY DESK BRIEFING: HISTORIC LIQUIDATION, AI DE-RISKING & RECORD VOL SPIKE
THE TAKE: VIOLENT RETEST, RECORD VOLATILITY EXPLOSION & COMPLETE ABSENCE OF TECH DEFENSE
A single session after the post-election relief rally, US equities suffered a historic, unhedged liquidation event across growth, cyclicals, and index benchmarks. The Nasdaq-100 plunged -6.36% to 26,629—its worst single-day decline since the March 9, 2020 peak-COVID shock (-6.83%). The S&P 500 tumbled -4.36% to 7,353, marking its steepest daily drawdown since April 4, 2025 (-5.97% tariff shock).
The primary catalyst was an aggressive fundamental re-calibration of post-election data center deployment trajectories, execution risks, and power/grid availability. This triggered an outright collapse across data center engineering and construction (E&C), Independent Power Producers (IPPs), neoclouds, and semiconductors. The Philadelphia Semiconductor Index (SOX) crashed -12.0% in its worst session since 2020, pushing valuation multiples down ~50% from their June/July peaks.
Unlike Wednesday's bifurcated action—where mega-cap hyperscalers absorbed semiconductor outflows—no offsetting bid appeared for hyperscalers or defensive tech. Instead, macro liquidation took over, with ETF volume surging to 32% of total exchange volume (26.83B total shares traded) and institutional phones lighting up with inbounds (10/10 inquiry volume) against thin high-touch risk-taking (5/10 execution activity).
BENCHMARK PERFORMANCE & CROSS-ASSET DASHBOARD
S&P 500 (SPX): Closed at 7,353.00 (-4.36%) | MOC $1.8B to BUY | VIX exploded +67.19% to 27.77 | Next-day implied straddle: 1.43%
Nasdaq-100 (NDX): Closed at 26,629.00 (-6.36%) | Worst session since March 9, 2020 COVID drawdown
Russell 2000 (RUT): Closed at 2,729.00 (-4.46%) | Broad small-cap liquidation despite lower yields
Dow Jones (DJI): Closed at 51,523.00 (-3.44%) | Industrial/value ballast gave way under macro pressure
US 10-Year Treasury: Yield down -5 bps to 4.83% | Flight-to-safety duration bid; curve flattening
WTI Crude: Price up +2.80% to $90.58/bbl | Bounced modestly off the sub-$89/bbl overnight low
Gold: Price up +0.57% to $4,084.00/oz | Steady safe-haven accumulation
Bitcoin: Price down -5.47% to $75,870.00 | Liquidated alongside high-beta tech/crypto risk
US Dollar Index (DXY): Up +1 bp to 101.58 | Static as rates declined
FACTOR DAMAGE, CTA BREACHES & FLOW METRICS
Factor & Theme Drawdown Records:
High Beta Momentum (
GSPRHIMO): Fell -6.2% on the session, extending its drawdown to -51% from June highs—the factor's worst multi-month peak-to-trough collapse in more than a decade.AI Pure Baskets: Multiple Goldman Sachs AI thematic baskets suffered their largest single-day drops since the public launch of ChatGPT in late 2022.
Systematic CTA Threshold Breach:
Index futures closed well below the medium-term CTA systematic threshold (7,549), invalidating Wednesday's recovery and activating algorithmic trend supply.
Projected systematic S&P 500 selling under morning -2.5 SD estimates is modeled at -$7.48B over the next 1-week window.
Floor Flow Dynamics:
Asset Managers (LOs): Finished as heavy net sellers, continuously offloading semiconductors and AI supply without rotating into defensive megacap tech.
Hedge Funds (HFs): Finished roughly balanced in net notional by aggressively toggling short books and shorting macro index products against long positions.
DERIVATIVES SURFACE COLOR: 9.3 VOL PANIC INDEX & SKEW SPIKE
Historic Vol of Vol Spike: The VVIX surged nearly +45 points—the second largest 1-day increase in market history, trailing only February 2018's "Volmageddon."
GS Vol Panic Index (9.3 / 10): Intraday readings on the proprietary Vol Panic Index (blending 1-month S&P implied volatility, VIX volatility, 1-month S&P skew, and term structure slope) printed at 9.3 out of 10.
Option Curve Inversion & Skew Steepening:
NDX and SPX fixed-strike volatilities were bid aggressively across the board, with intense panic demand concentrated in front-month tenors.
Put skew steepened dramatically as participants paid top-of-cycle premia for immediate downside index hedges.
Flows & Hedge Restructuring:
Institutional desks observed massive monetization of in-the-money VIX calls as the index surpassed 26–27.
Fresh institutional downside structures were initiated lower on the surface, including a client purchase of 22,000 contracts of the SPY 27Nov 700/730 Put Spread.
Implied Event Pricing Ahead of NFP:
The implied move for Friday's session (incorporating the October US Employment Situation) expanded to 1.43% (a sharp jump from the 91 bps full-week straddle priced at Wednesday's settle).
Disclaimer: The material provided is for information purposes only and should not be considered as investment advice. The views, information, or opinions expressed in the text belong solely to the author, and not to the author’s employer, organization, committee or other group or individual or company.
Past performance is not indicative of future results.
High Risk Warning: CFDs are complex instruments and come with a high risk of losing money rapidly due to leverage. 68% and 74% of retail investor accounts lose money when trading CFDs with Tickmill UK Ltd and Tickmill Europe Ltd respectively. You should consider whether you understand how CFDs work and whether you can afford to take the high risk of losing your money.
Futures and Options: Trading futures and options on margin carries a high degree of risk and may result in losses exceeding your initial investment. These products are not suitable for all investors. Ensure you fully understand the risks and take appropriate care to manage your risk.
Patrick has been involved in the financial markets for well over a decade as a self-educated professional trader and money manager. Flitting between the roles of market commentator, analyst and mentor, Patrick has improved the technical skills and psychological stance of literally hundreds of traders – coaching them to become savvy market operators!