S&P500 Daily Action Areas & Price Targets 28/7/26

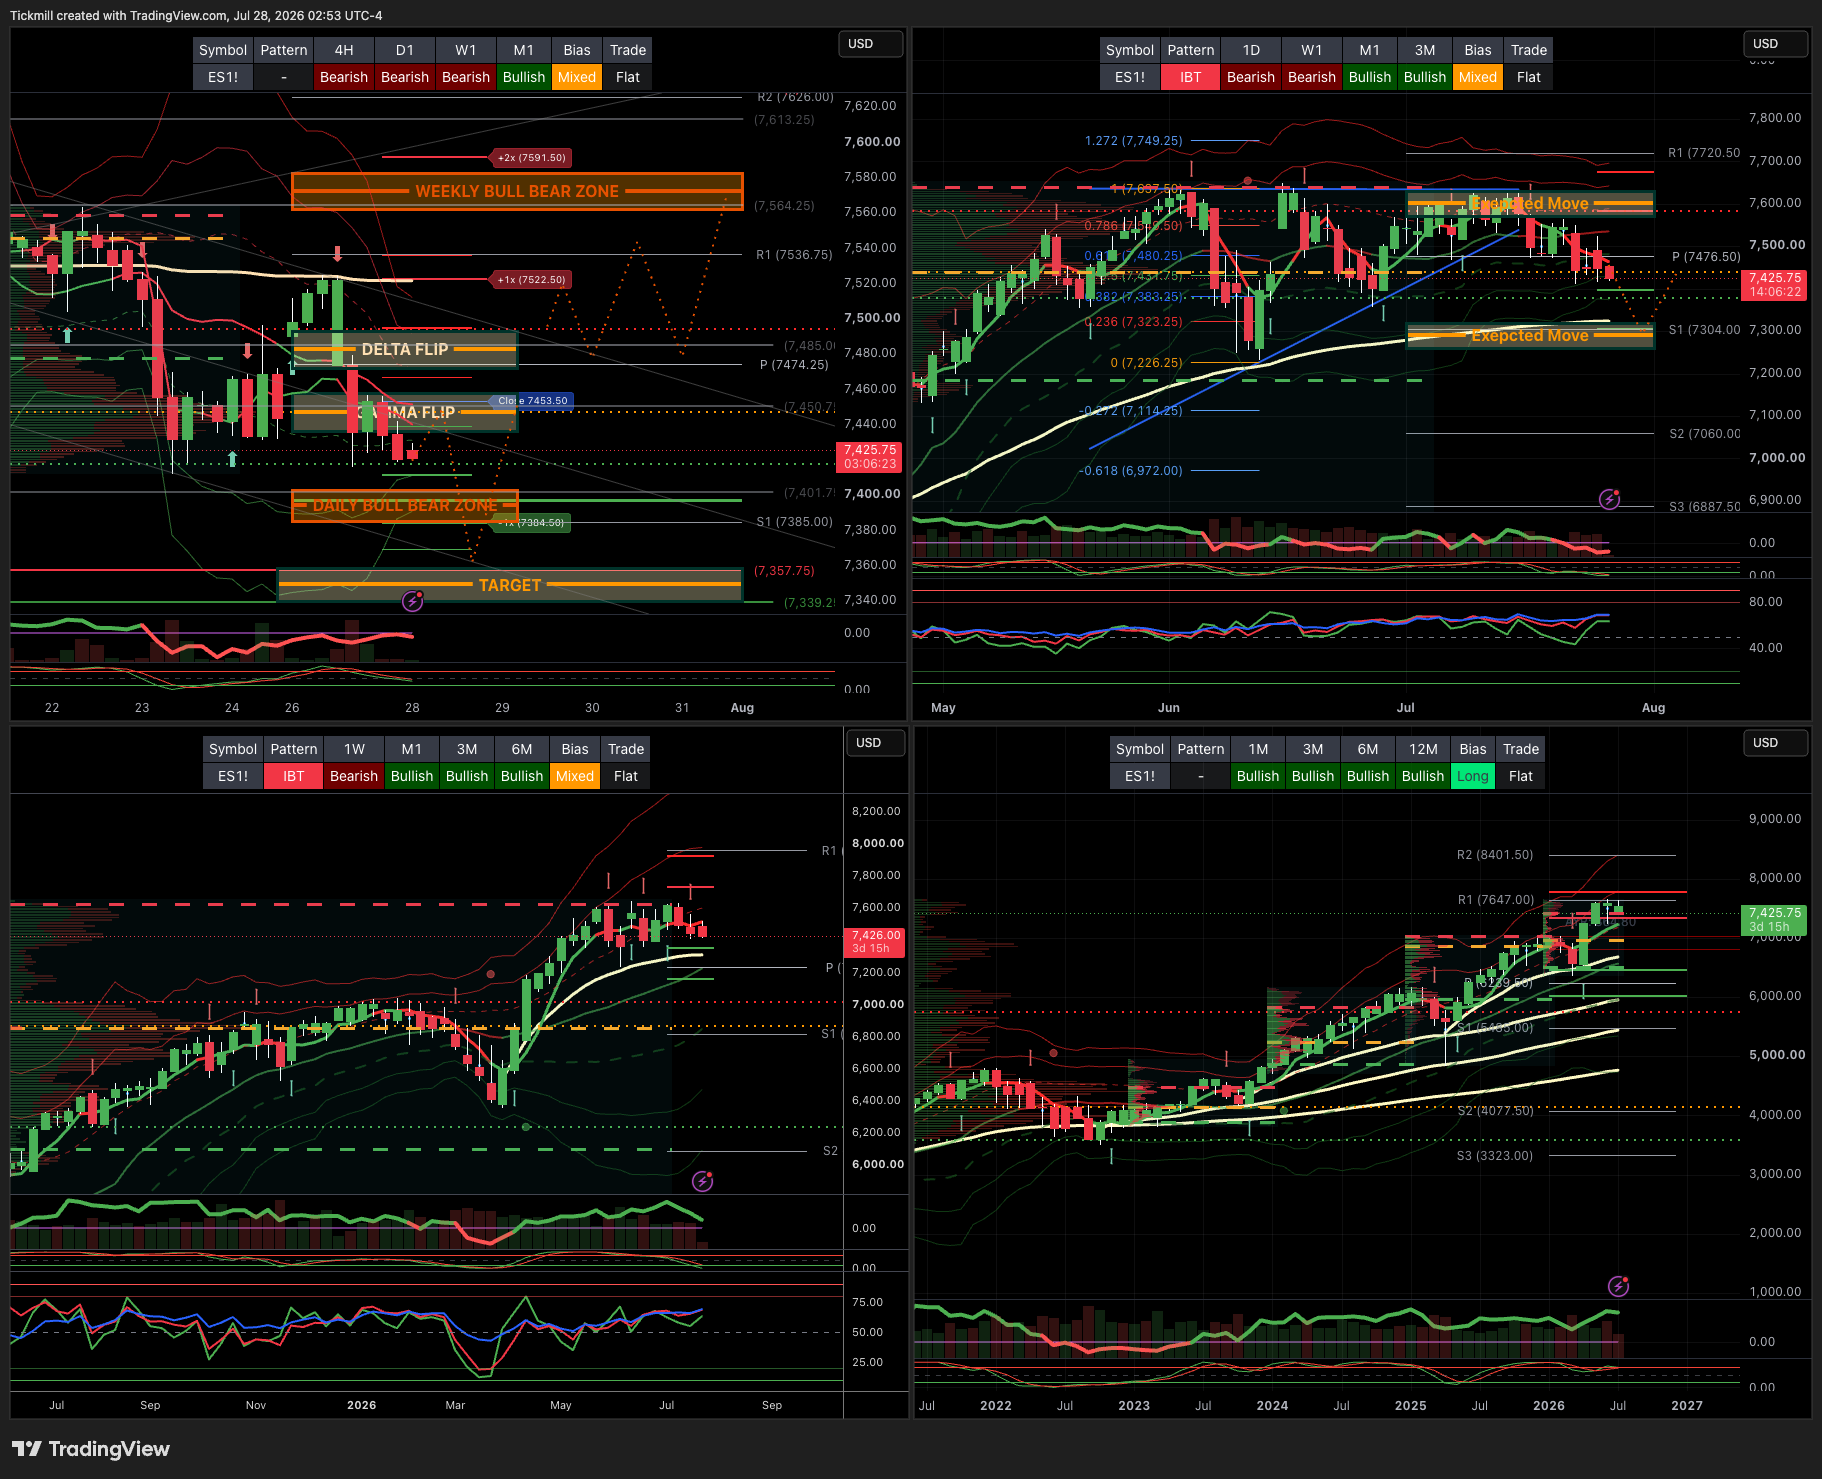
S&P500 Daily Action Areas & Price Targets 28/7/26
***QUOTING ES1! FOR CASH US500 EQUIVALENT LEVELS, SUBTRACT POINT DIFFERENCE***
WEEKLY BULL BEAR ZONE 7560/80
WEEKLY RANGE RES 7602 SUP 7301
MONTHLY RANGE RES 7838 SUP 7258
JHEQX Q3 Collar Short Call Cap: ~7,750 – 7,900 - Long Put Strike: ~7,050 – 7,100 (approx. 5% downside protection) Short Put Strike: ~5,950
DEC2025 OPEX to DEC2026 OPEX is 945 points giving us a range of [5889,7779]
SPX PUT/CALL RATIO 1.06 (The numbers reflect options traded during the current session.) A put-call ratio below 0.7 is generally considered bullish, and a put-call ratio above 1.0 is generally considered bearish.
GS Flow Desk: large S&P 31Aug 7000/7950 strangle in roughly $20mm vega / $115mm premium …My Read – classic “big convexity versus carry” trade: either someone paid a lot to own a wide August move, or someone got paid a lot to bet that the S&P stays comfortably inside the 7000–7950 corridor
DAILY VWAP BEARISH 7460
WEEKLY VWAP BEARISH 7522
MONTHLY VWAP BULLISH 7036
DAILY STRUCTURE - BALANCE - 7411/7514
WEEKLY STRUCTURE - BALANCE 7648/7247
MONTHLY STRUCTURE - OTFH - 7247
Balance: This refers to a market condition where prices move within a defined range, reflecting uncertainty as participants await further market-generated information. Our approach to balance includes favouring fade trades at the range extremes (highs/lows) while preparing for potential breakout scenarios if the balance shifts.
One-Time Framing Higher (OTFH): This represents a market trend where each successive bar forms a higher low, signalling a strong and consistent upward movement.
One-Time Framing Lower (OTFL): This describes a market trend where each successive bar forms a lower high, indicating a pronounced and steady downward movement.
DAILY BULL BEAR ZONE 7400/7385
GAMMA FLIP 7446
DELTA FLIP 7482
DAILY RANGE RES 7512 SUP 7376
2 SIGMA RES 7580 SUP 7308
VIX BULL BEAR ZONE 17.9
TRADES & TARGETS
LONG ON REJECT/RECLAIM DAILY BEAR ZONE TARGET CLOSE
***ADDITIONAL SETUPS & TARGETS HIGHLIGHTED ON THE CHARTS***
(I FADE TESTS OF 2 SIGMA LEVELS ESPECIALLY INTO THE FINAL HOUR OF THE NY CASH SESSION AS 90% OF THE TIME WHEN TESTED THE MARKET WILL CLOSE ABOVE OR BELOW THESE LEVELS)
GOLDMAN SACHS FICC & EQUITY TRADING DESK VIEWS
US Equities Close — Momentum Unwind Resumes, Indexes Mask Gross-Down Tape
US equities closed mixed but the index tape understated the violence underneath the surface. The S&P finished essentially flat at 7,413, helped by a US$1.5bn MOC buy, while the Nasdaq slipped 32bps and Russell 2000 outperformed, up 66bps. But under the hood, the market had a clear gross-down / unwindy feel, with the Momentum factor down roughly 7% and heavy pressure across semis, memory, and AI-linked popular longs.
This was not a broad index crash; it was a positioning event. Software / Internet rallied roughly 4%, while Semis fell 3.5%, and the most popular semiconductor longs were hit hardest. That is classic factor unwind behavior: longs get sold, shorts / underweights squeeze, and dispersion explodes while the headline index looks deceptively calm.
The market is now waiting for two major catalysts: FOMC Wednesday, where the market is pricing roughly 35% odds of a hike, and the mega-cap tech earnings slate with META / MSFT Wednesday and AAPL / AMZN Thursday.
1. Closing Snapshot
Asset / Index | Move | Close |
|---|---|---|
S&P 500 | +2bps | 7,413 |
Nasdaq 100 | -32bps | 28,039 |
Russell 2000 | +66bps | 2,949 |
Dow | +51bps | 52,209 |
VIX | +81bps | 18.73 |
WTI Crude | -820bps | US$81.99 |
US 10Y Yield | -3bps | 4.6467% |
Gold | +73bps | US$4,082 |
DXY | +4bps | 101.51 |
Bitcoin | +55bps | US$64,941 |
Volume was light: 15.849bn shares traded across US exchanges versus the YTD daily average of 19.353bn. That poor liquidity likely exacerbated factor volatility and the gross-down feel.
2. Momentum Factor Hit Again
The defining feature of the day was renewed pressure on Momentum, down roughly 7%. This is especially painful because the factor unwind has already hurt fundamental long/short funds badly in July.
Fundamental L/S hedge funds are now down 4.5% in July, marking the second-worst monthly performance since 2023, though they remain up 13% YTD.
This explains why there was so little appetite to defend popular longs. Managers have already taken pain, gross exposure is low, and they are reluctant to re-risk ahead of the Fed and mega-cap earnings.
Positioning Metric | Latest | 1Y Percentile |
|---|---|---|
L/S gross exposure | 204.2 | 6th percentile |
L/S net exposure | 51.7 | 22nd percentile |
GS Sentiment Indicator | 0.6 | Lowest in 5 weeks |
Gross is already very low, but the unwind is still ongoing because factor books and long-only ownership remain vulnerable.
3. Semis / AI Under Pressure, Software / Internet Squeezes
The most important under-surface move was the divergence between Software / Internet and Semis:
Group | Move |
|---|---|
Software / Internet | +4% |
Semis | -3.5% |
Momentum Factor | -7% |
The popular semiconductor longs were hit hardest:
AMD -6%
SNDK -13%
Semicap Equipment -5% to -7%
This is a clear sign that investors are cutting crowded AI / semiconductor exposure while covering shorts or reallocating into less crowded tech pockets. It is not simply “tech down.” It is very specific: AI momentum / semi longs are being unwound.
4. Fundamental Concerns Driving AI / Semi Pressure
Three local fundamental concerns were cited:
1. NVDA / OpenAI Deal and “Circular Financing”
The NVDA / OpenAI deal reignited concerns around circular financing. Investors are increasingly asking whether AI demand is organic and self-funding, or whether parts of the ecosystem are being supported by vendor financing, strategic investments, or circular capital flows.
The concern is not that AI demand is fake. The concern is whether the economics are as clean and scalable as previously assumed.
2. China Homegrown DUV Tools
Reports that China is beginning to make homegrown DUV chipmaking tools added pressure to semicap equipment. This raises questions around long-term competitive dynamics, export-control efficacy, and localization risk.
For semicap names, any credible evidence of China tool-chain substitution can compress multiples, especially after a large AI / capex-driven run.
3. Cheaper Chinese Open-Source Models
Lingering concerns around cheaper Chinese open-source models, such as Kimi K3, also weighed on sentiment. These models have gained global popularity and feed the debate around AI monetization and compute intensity.
If capable models can be trained or deployed more cheaply, the market may question the slope and durability of hyperscaler and semiconductor capex expectations.
Together, these concerns hit the core AI market narrative:
Is AI capex too circular?
Are semicap moats weakening?
Is compute demand less linear than expected?
Can cheaper open-source models disrupt pricing power?
Are hyperscalers overspending?
5. Flow Tone: Very Little Defense
The floor activity level was only 3 out of 10, but flows were heavily skewed for sale, finishing -438bps for sale versus a 30-day average of -30bps. That suggests the market was not broadly active, but the activity that did occur was de-risking.
There was very little defense. Investors appear to be sitting on hands ahead of:
FOMC Wednesday
35% hike odds
META / MSFT earnings Wednesday
AAPL / AMZN earnings Thursday
Choppy macro backdrop
Iran headlines
Momentum unwind
Hedge funds have been sporadically cutting single-stock risk again, while long-only managers remain very quiet.
That is important. When long-only investors are not stepping in, crowded longs can gap lower in poor liquidity.
6. Derivatives: Short-Dated Skew Is Getting Bid
The derivatives desk described the main story as a positioning-driven momentum unwind that triggered a quick selloff within the first hour. Overall vol desk flows were muted as clients wait for mega-cap earnings and the FOMC meeting.
But short-dated skew has become meaningfully bid, particularly in RUT / IWM.
This is notable because the Russell has been outperforming SPX and NDX on the year, but is vulnerable to a larger pullback if the Fed hikes. The desk likes buying:
IWM 31Jul puts
IWM 7Aug puts
as hedges for a potential hike.
Dealer Gamma Setup
The majority of dealer gamma is now to the topside as the market trades around the 50-day moving average. That means the stabilizing gamma is above spot, not below. On a downside move, dealers may become less stabilizing or even pro-cyclical.
The implication:
Upside moves may be dampened near top-side gamma.
Downside moves can accelerate if spot falls away from gamma.
Larger downside moves may be exacerbated.
The straddle for the rest of the week closed at 1.57%, implying the market is still not pricing a full panic event despite major catalysts.
7. Mega-Cap Earnings Setup
This week’s Mag 7 reports are critical because the market has already shown poor reactions to tech beats. The key question is whether mega-cap tech can stabilize the tape or whether “beat-and-fade” continues.
META — Reports Wednesday
Metric | Detail |
|---|---|
Implied move | 5.5% |
Positioning | 6.5 / 10 |
YTD performance | -8.85% |
Investor focus:
Revenue trends
Capex visibility
Opex visibility
Product roadmap into 2027+
META needs to show that AI investment is supporting advertising, engagement, and product monetization without creating uncontrolled expense growth.
MSFT — Reports Wednesday
Metric | Detail |
|---|---|
Implied move | 6.3% |
Positioning | 5 / 10 |
YTD performance | -19.3% |
The bar feels lower here. Investors want a narrative shift.
Focus areas:
Azure growth
Azure guide
Expectations in low-40s
M365 growth
AI monetization evidence
Given the stock is already down nearly 19% YTD, MSFT may have more room to positively surprise if management can reset the narrative around AI monetization and cloud durability.
AAPL — Reports Thursday
Metric | Detail |
|---|---|
Implied move | 3.3% |
Positioning | 7.5 / 10 |
YTD performance | +24% |
Investor expectations:
Beat
Guide above
Services revenue
Gross margin outlook
Input cost headwinds
AAPL is more crowded and has outperformed sharply. It is being treated as a defensive mega-cap / quality name, but high positioning means the reaction function could be demanding.
AMZN — Reports Thursday
Metric | Detail |
|---|---|
Implied move | 6.3% |
Positioning | 7.5 / 10 |
YTD performance | +0.49% |
Focus areas:
AWS growth
Expectations in low/mid-30s
Margins
3Q operating income guide
AMZN needs to deliver both AWS acceleration and margin discipline. If capex intensity rises without clearer AWS / AI monetization, the stock could be vulnerable.
8. Index Levels and Implied Range
SPX closed at 7,413. The rest-of-week straddle implies 1.57%, or roughly:
So the implied range into week-end is approximately:
7,297 to 7,529
Level | Significance |
|---|---|
7,529 | Rest-of-week implied upper bound |
7,480 | Key pivot / prior tactical level |
7,413 | Current close |
7,400 | Immediate downside support |
7,300 | Important downside gamma zone |
7,297 | Rest-of-week implied lower bound |
The lower bound around 7,297 is especially important because it overlaps with previously flagged August downside positioning below 7,300. If SPX trades into that zone, dealer hedging and CTA de-risking risks become more relevant.
9. Macro Cross-Asset Read
The cross-asset picture was somewhat more supportive than the equity-factor tape:
WTI crude fell sharply, down 8.2% to US$81.99.
The 10Y yield slipped modestly to 4.6467%.
Gold rose 73bps to US$4,082.
DXY was roughly flat.
Bitcoin rose slightly.
Normally, lower oil and slightly lower yields should help long-duration equities. The fact that semis / AI still sold off hard despite this macro relief suggests the move was mainly positioning / fundamental concern driven rather than purely macro.
That distinction matters. If AI / semi weakness persists even with oil and yields down, earnings will need to do much more work to stabilize the group.
10. Tactical Takeaways
1. This Was a Gross-Down Tape
The combination of momentum down, popular longs hit, shorts outperforming, and low activity points to risk reduction rather than a clean macro beta selloff.
2. Semis Remain the Pressure Point
The AI unwind is increasingly concentrated in semis / semicap / memory, with fundamental concerns around circular financing, China substitution, and cheaper AI models adding to positioning stress.
3. Mega-Cap Tech Must Deliver
MSFT / META / AAPL / AMZN are now the stabilization test. The market needs more than beats; it needs credible capex discipline, ROIC evidence, and monetization clarity.
4. Index Vol Risk Is Rising
Even though SPX closed flat, downside skew is bid and dealer gamma is top-side. A move below 7,300 could become unstable.
5. IWM Downside Is a Clean Fed Hedge
Given Russell outperformance and short-dated RUT skew demand, IWM puts are a favored hedge into a potential Fed hike.
Disclaimer: The material provided is for information purposes only and should not be considered as investment advice. The views, information, or opinions expressed in the text belong solely to the author, and not to the author’s employer, organization, committee or other group or individual or company.
Past performance is not indicative of future results.
High Risk Warning: CFDs are complex instruments and come with a high risk of losing money rapidly due to leverage. 69% and 73% of retail investor accounts lose money when trading CFDs with Tickmill UK Ltd and Tickmill Europe Ltd respectively. You should consider whether you understand how CFDs work and whether you can afford to take the high risk of losing your money.
Futures and Options: Trading futures and options on margin carries a high degree of risk and may result in losses exceeding your initial investment. These products are not suitable for all investors. Ensure you fully understand the risks and take appropriate care to manage your risk.
Patrick has been involved in the financial markets for well over a decade as a self-educated professional trader and money manager. Flitting between the roles of market commentator, analyst and mentor, Patrick has improved the technical skills and psychological stance of literally hundreds of traders – coaching them to become savvy market operators!